
VISUAL CONTENT ANALYTICS & KPIs
In the era of digital dominance, content is king, and visuals reign supreme. However, with the influx of social media platforms, it may appear confusing as to which platform may be best suited for your business in the long run and not just based on the current trends. Thus, we have collated analytics into the trending and current social media platforms and this blog post will also delve into the key performance indicators (KPIs) that will help your business harness the full potential of your visual content.
As mentioned in our previous blog 'Maximising ROI: Allocating Your 2024 Budget’, visual content in absolutely any form plays a pivotal role in capturing the attention of your audience, whether that be in the form of images, videos or even infographics. To put it plainly and simply, visual content stands out and communicates messages faster and more effectively in comparison to text alone.
Visual content analytics is the process of measuring and analysing the performance of your visual assets. By doing so, you can gain insights into what works and what doesn't. This information allows you to refine your content strategy, ensuring that it resonates with your audience and achieves your business goals.
“It’s not what you sell that matters as much as how you sell it!”
KPI’s for Visual Content
Engagement: Measuring likes, comments, and shares on your visual content provides valuable insight into its effectiveness. Measuring shares is especially effective as it provides your business with the numbers as to how many people find your content informative and insightful.
Conversion Rate: Track the number of visitors who take a desired action after engaging with your visual content.
Click-Through Rate (CTR): Monitor how many people click on links within your visual content. CTR is a fundamental KPI for evaluating the performance of your calls to action.
Bounce Rate: Keep an eye on the percentage of visitors who leave your site after viewing a single page. Reducing this rate is essential for keeping your audience engaged.
Brand Awareness: Gauge how well your visual content contributes to brand recognition.
Social Shares: Count the number of times your visual content is shared on social media platforms. Sharing is caring, and your audience's willingness to share your content speaks volumes.
It may be difficult and confusing to decide which platform may be best suited for your business so here’s a list of other brands that have immensely benefited from their social media presence:
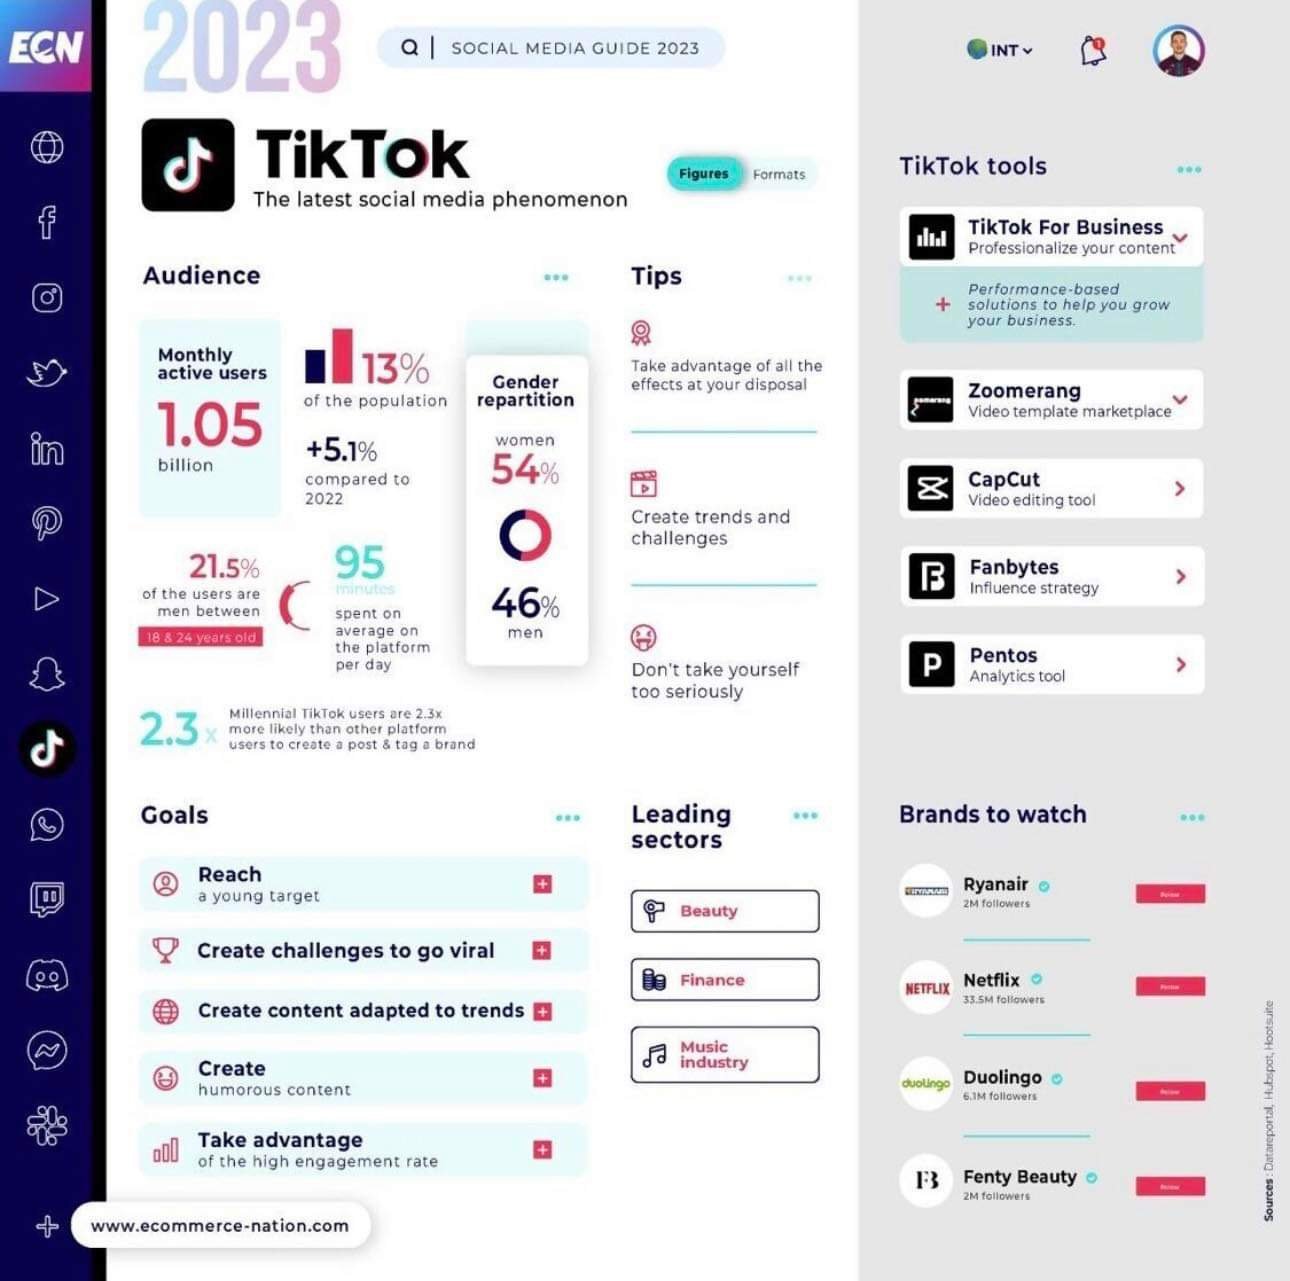
TIKTOK:
Penguin Books Australia: Just as lawyers would know law firms, book lovers would most definitely know about Penguin Books. However, with its recent uprising popularity on Tiktok, Penguin Books Australia has appeared on the for-you pages (FYPs) of audiences of all dynamics such as Kpop fans and the general audience. This is through their incorporation of books and trending audio and dances. Sounds weird but it works!
Addison Rae: Her dance videos and relatable content made Addison Rae an overnight Tiktok sensation and she has since ventured into music and acting, further increasing her popularity.


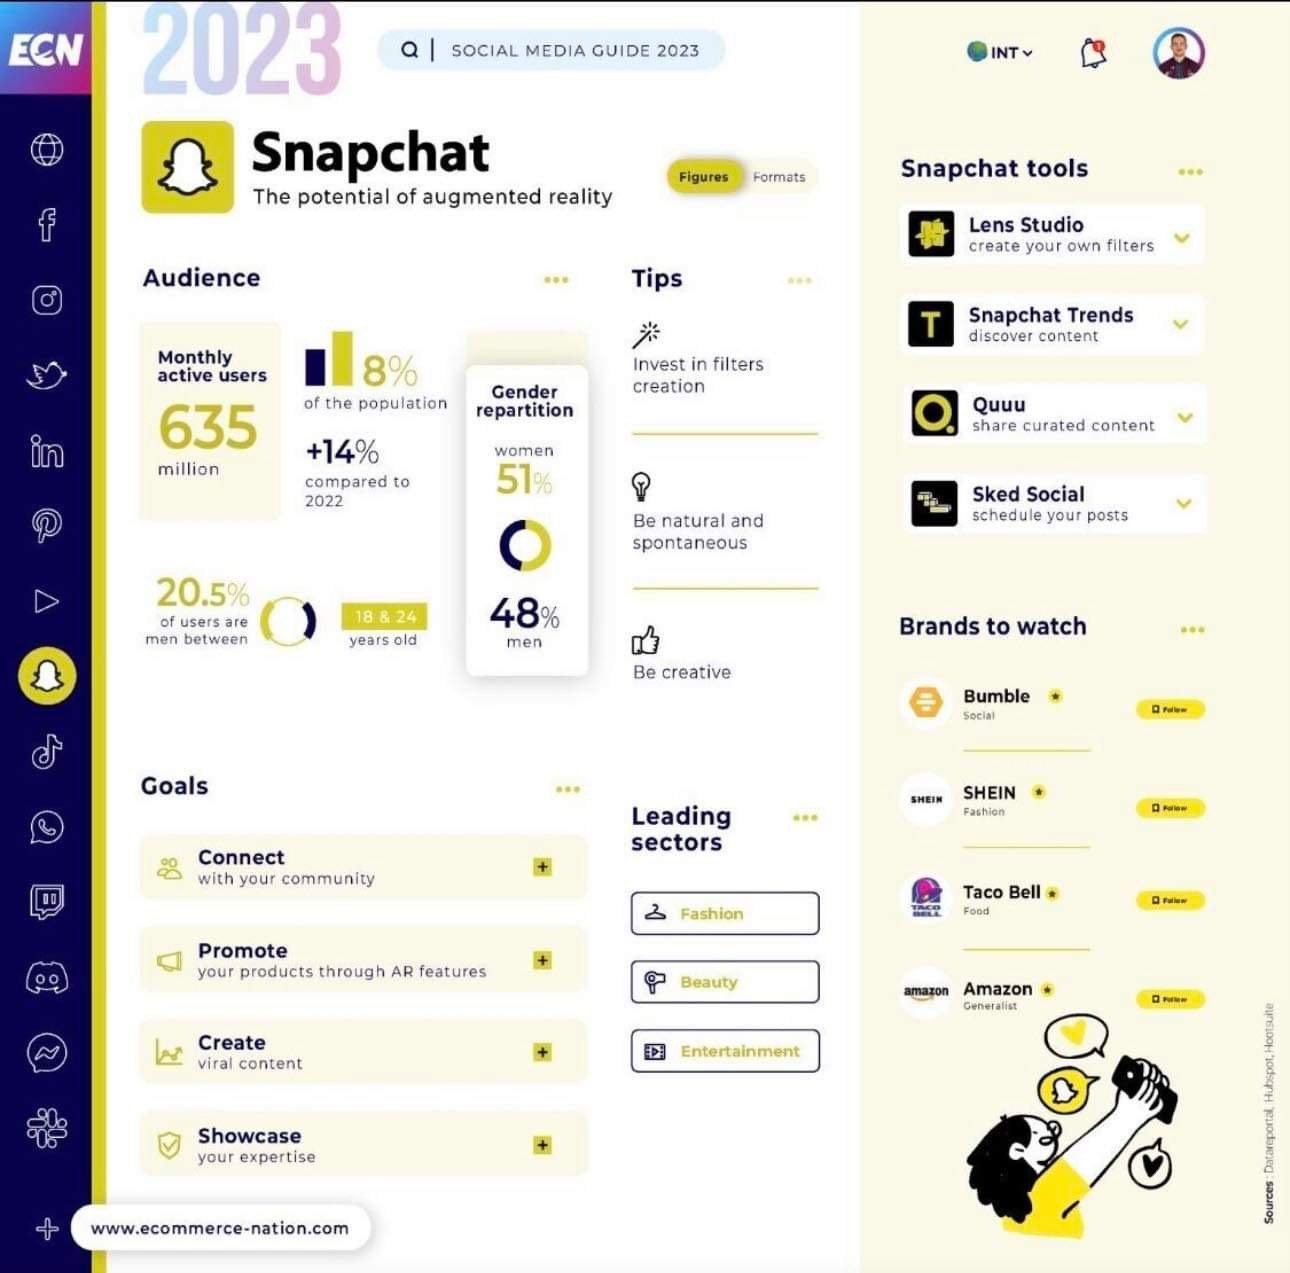
SNAPCHAT:
Gucci: Despite being a high-end luxury brand, Gucci stepped outside of its comfort zone and gave Snapchat a shot and it proved immensely successful. Gucci used Snapchat for exclusive behind-the-scenes content during fashion shows and collaborations, attracting a younger and tech-savvy audience.'
Taco Bell: Taco Bell effectively used Snapchat to promote new menu items and run interactive contests, engaging their audience in a fun and unique way.
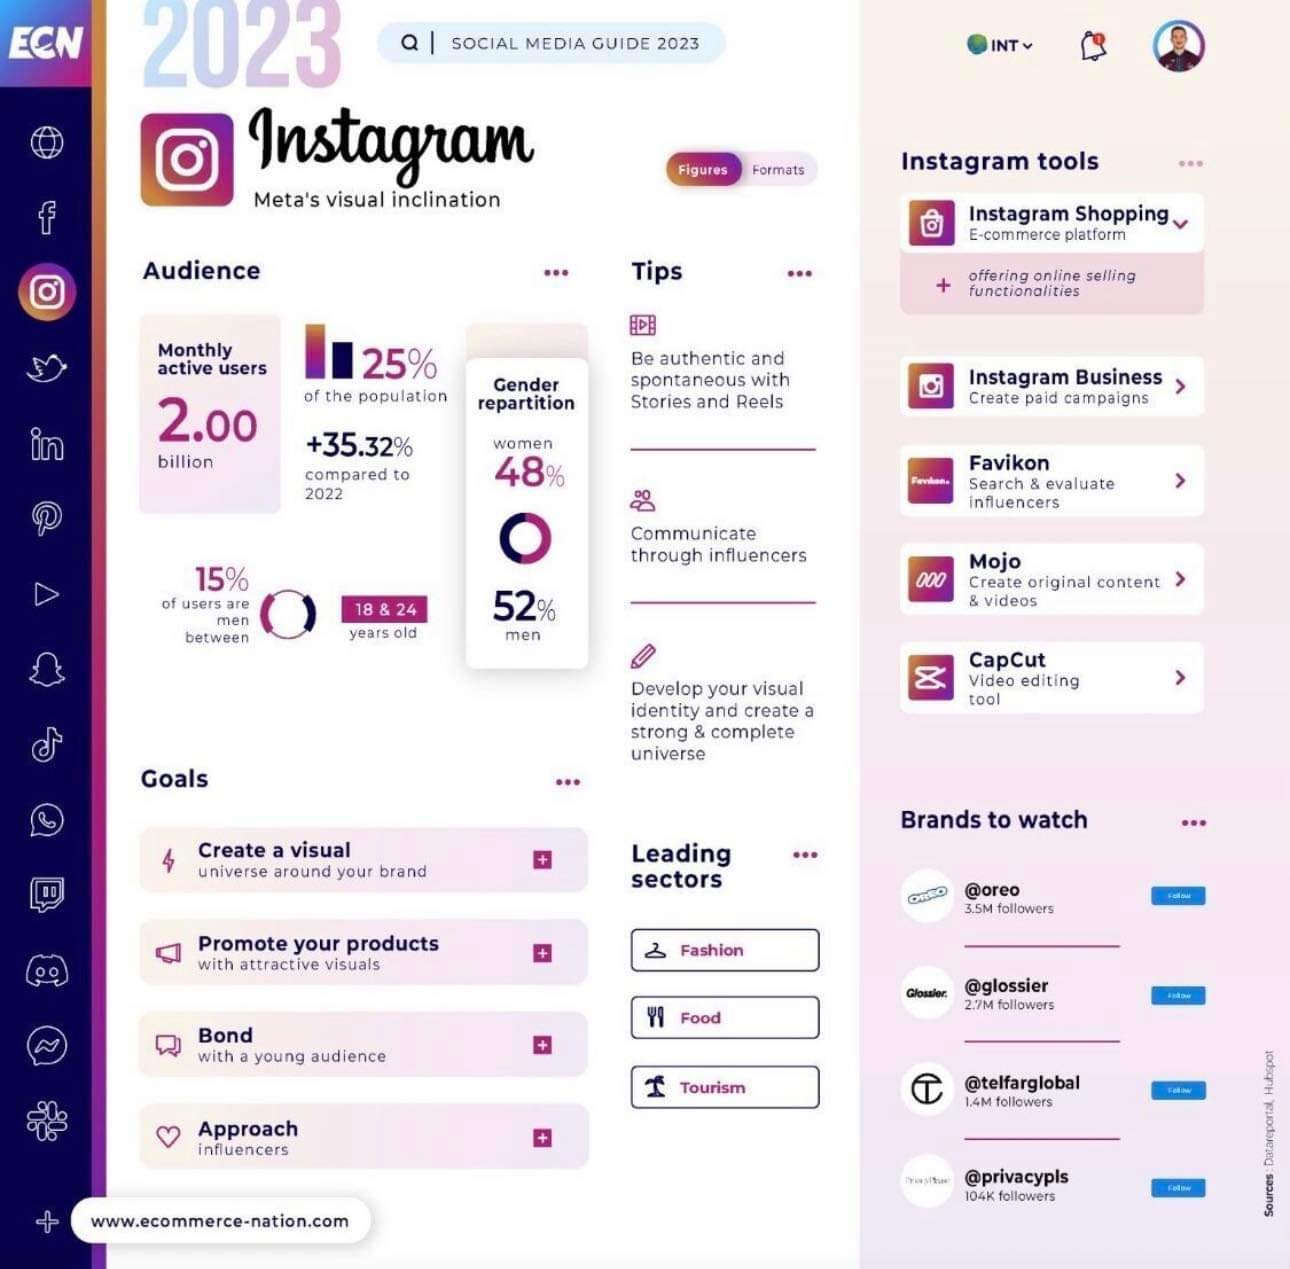
INSTAGRAM:
Fashion Nova: If you haven’t received an advertisement or partnered collaboration from Fashion Nova, consider yourself the lucky 1% that hasn’t been blessed by these sponsored posts. Fashion Nova, an online fashion retailer, heavily utilised Instagram to showcase trendy and affordable clothing on a diverse range of models. Their influencer partnerships and user-generated content played a significant role in their social media success.
TWITTER:
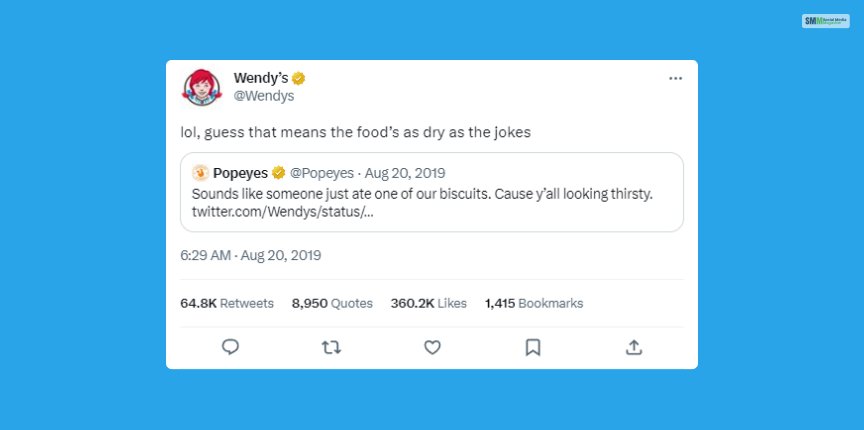
Wendy’s: The fast food chain has gained immense attention and popularity for its witty and hilarious responses on Twitter. Their quick and clever comebacks in response to customer inquiries and comments made them a viral sensation on the platform.
Tesla: The electric car manufacturer is not only popular for promoting the awareness of electric cars but also for its sleek designs and equally sleek CEO, Elon Musk. Musk's tweets and product updates have generated widespread attention and discussion, contributing to Tesla's popularity. Additionally, it helps that Elon Musk’s personal social media presence is just as big. These examples showcase how both brands and celebrities have harnessed the unique features of TikTok and Snapchat to increase their popularity and engage with their audiences in innovative ways.

These examples demonstrate how various companies and brands leveraged different social media platforms to significantly boost their popularity and engage with their target audiences. When it comes to visual content analytics, the little details matter too. By utilising these KPIs, you can tailor your visual content strategy to align with your brand, engage your audience, and drive results. Visual content analytics isn't just about numbers; it's about telling a compelling story through visuals.
In conclusion, the world of visual content is brimming with opportunities, and analysing your visual content's performance is key to unlocking its full potential. By focusing on these KPIs, you can create visual content that not only engages but also drives meaningful results for your brand.